 The NEW SCORPION® 2 Digital Air Velocity Sensor Array delivers a precise picture of airflow patterns inside an oven, dryer or cooling tunnel, from side-to-side and end-to-end. Our redesigned sensory array combines several technological breakthroughs to improve compared to other Air Velocity sensors. Individual sensor modules within an array consist of thin-film platinum RTD hot-wire anemometers. Proprietary Smart Temperature Compensation allows our calibrated arrays to self-adjust for both high and low temperature environments intelligently as conditions change from process to process.
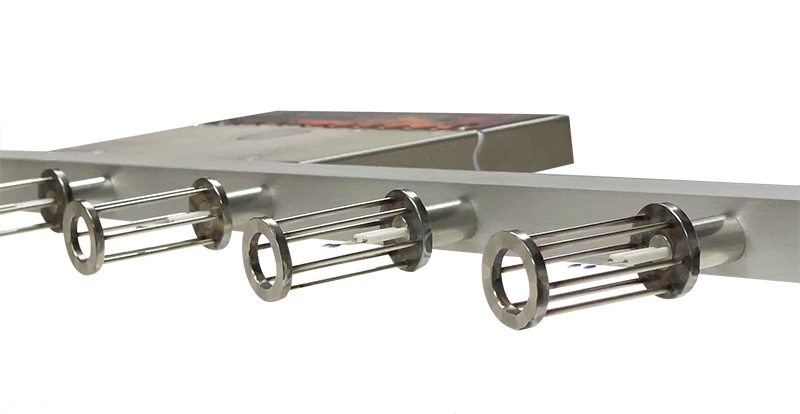
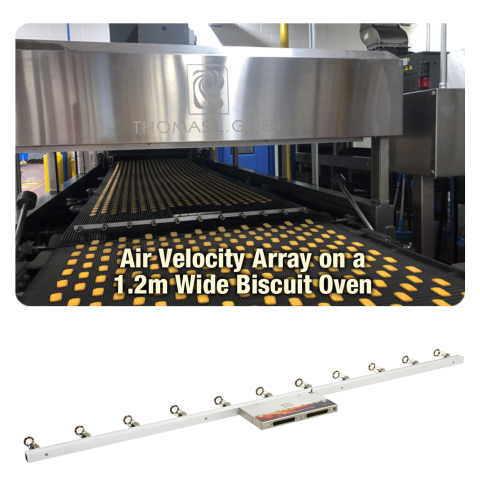
To gather data, the Sensor Array is connected to the SCORPION® 2 Data Logger and is run through the process at product level. Air Velocity Sensors are evenly spaced across the length of a bar, which is selected to match the width of the conveyor.The fixed position sensors collect data as the array passes through the process and displays the results in m/sec or ft/min. The number of sensors varies with the length of the bar/conveyor width.
View Standard Array Configurations
Why is Air Velocity Profiling important?
Even distribution of airflow is vital in maintaining the quality of product delivered by any oven system. In a radiant oven, (e.g. ribbon burners) the airflow comes from the moving conveyor, the exhaust system, and natural combustion air currents. In a convection oven, (e.g. air recirculation) the airflow comes primarily from the air distribution plenums. In this case, airflow is of particular importance because it directly controls the amount of heat delivered to the product.
Analyzing the Results
SCORPION® Software (SV8) is used to download the data from the SCORPION® 2 Data Logger and analyze the results. Each sensor output is the sum of air velocity components from all directions, and can be displayed as a line (channel) in a 2D Line Graph.
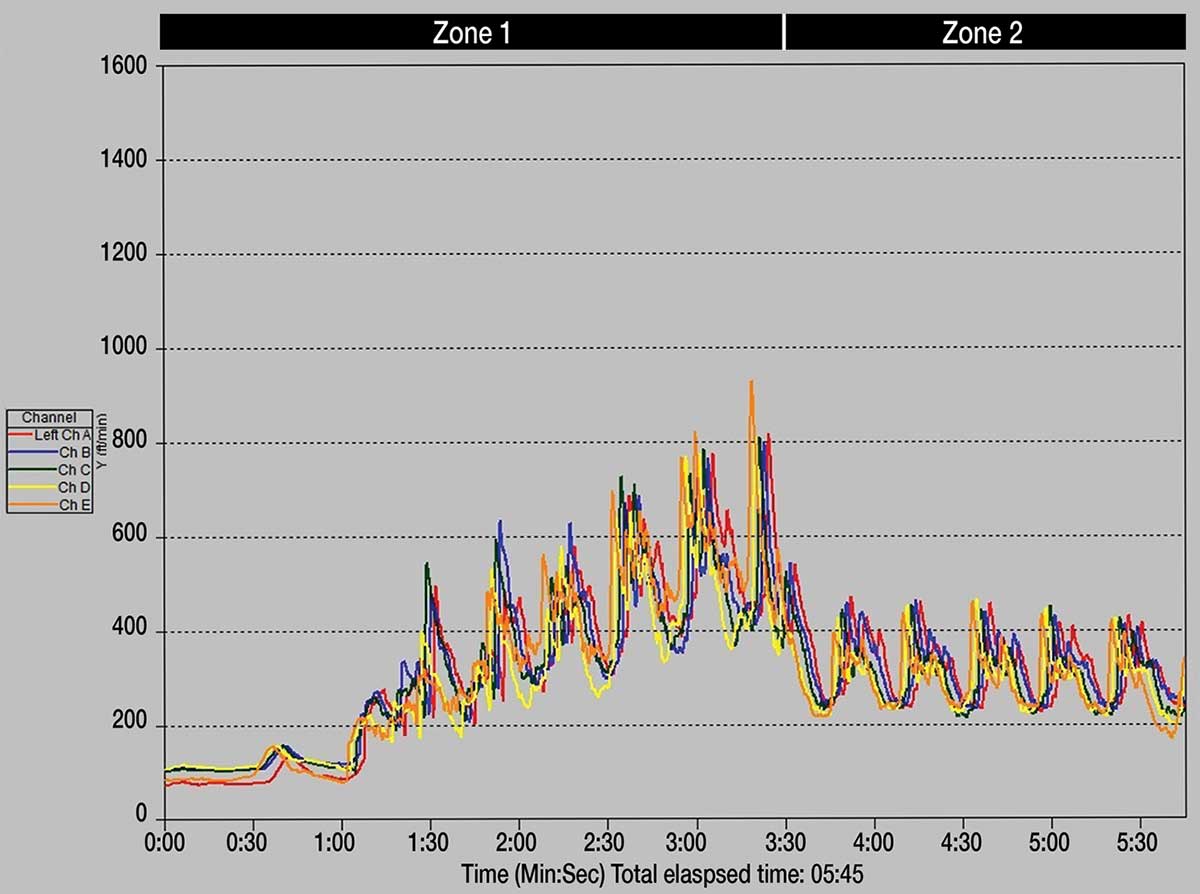 2D Line Graph
- Each sensor is represented by a colored line (channel).
- The tighter the pattern of lines, the more even the airflow is across the width of the band.
Side-to-side airflow variation is directly related to side-to-side variation in product bake, and represents a critical measurement displayed by the Digital Air Velocity Sensor Array. The tighter the pattern of lines, the more even the air distribution is across the width of the process.
Visually, side-to-side variation is better displayed in a 3D Mesh Graph, which in this example is showing greater than 1.2 m/sec (250 ft/min) airflow variation in several areas of the oven.
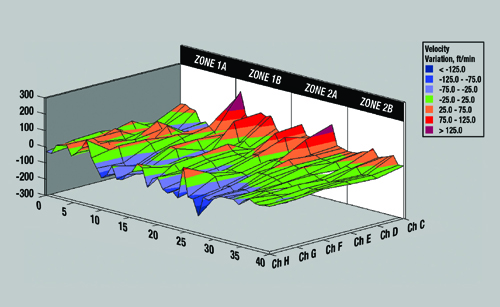 3D Mesh Graph
- Side-to-side variation is greater than 1.2 m/sec (250 ft/min).
- Higher airflow (red) left side and lower airflow (blue) right side.
The Digital Air Velocity Sensor Array can help you spot airflow differences between baking zones, concentrated air velocities on isolated parts of the conveyor, and unwanted air currents at the entrance or exit of the oven. Air Velocity Profiles are useful in adjusting your process to maximize quality and reduce waste.
Case Study
Locating the Source of Oven Fires
Problem: Breadsticks entered a bakery’s oven properly oriented and evenly spaced on the conveyor. In the oven product lifted off the belt, and became disoriented; some fell from the conveyor, built up in the second zone, and caused oven fires… Click the case study link above to see how Air Velocity Profiling helped solve this problem.