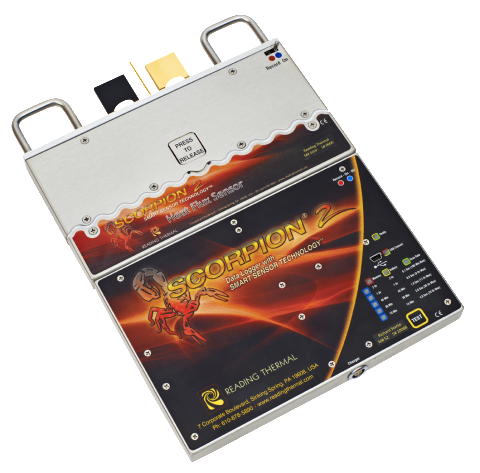
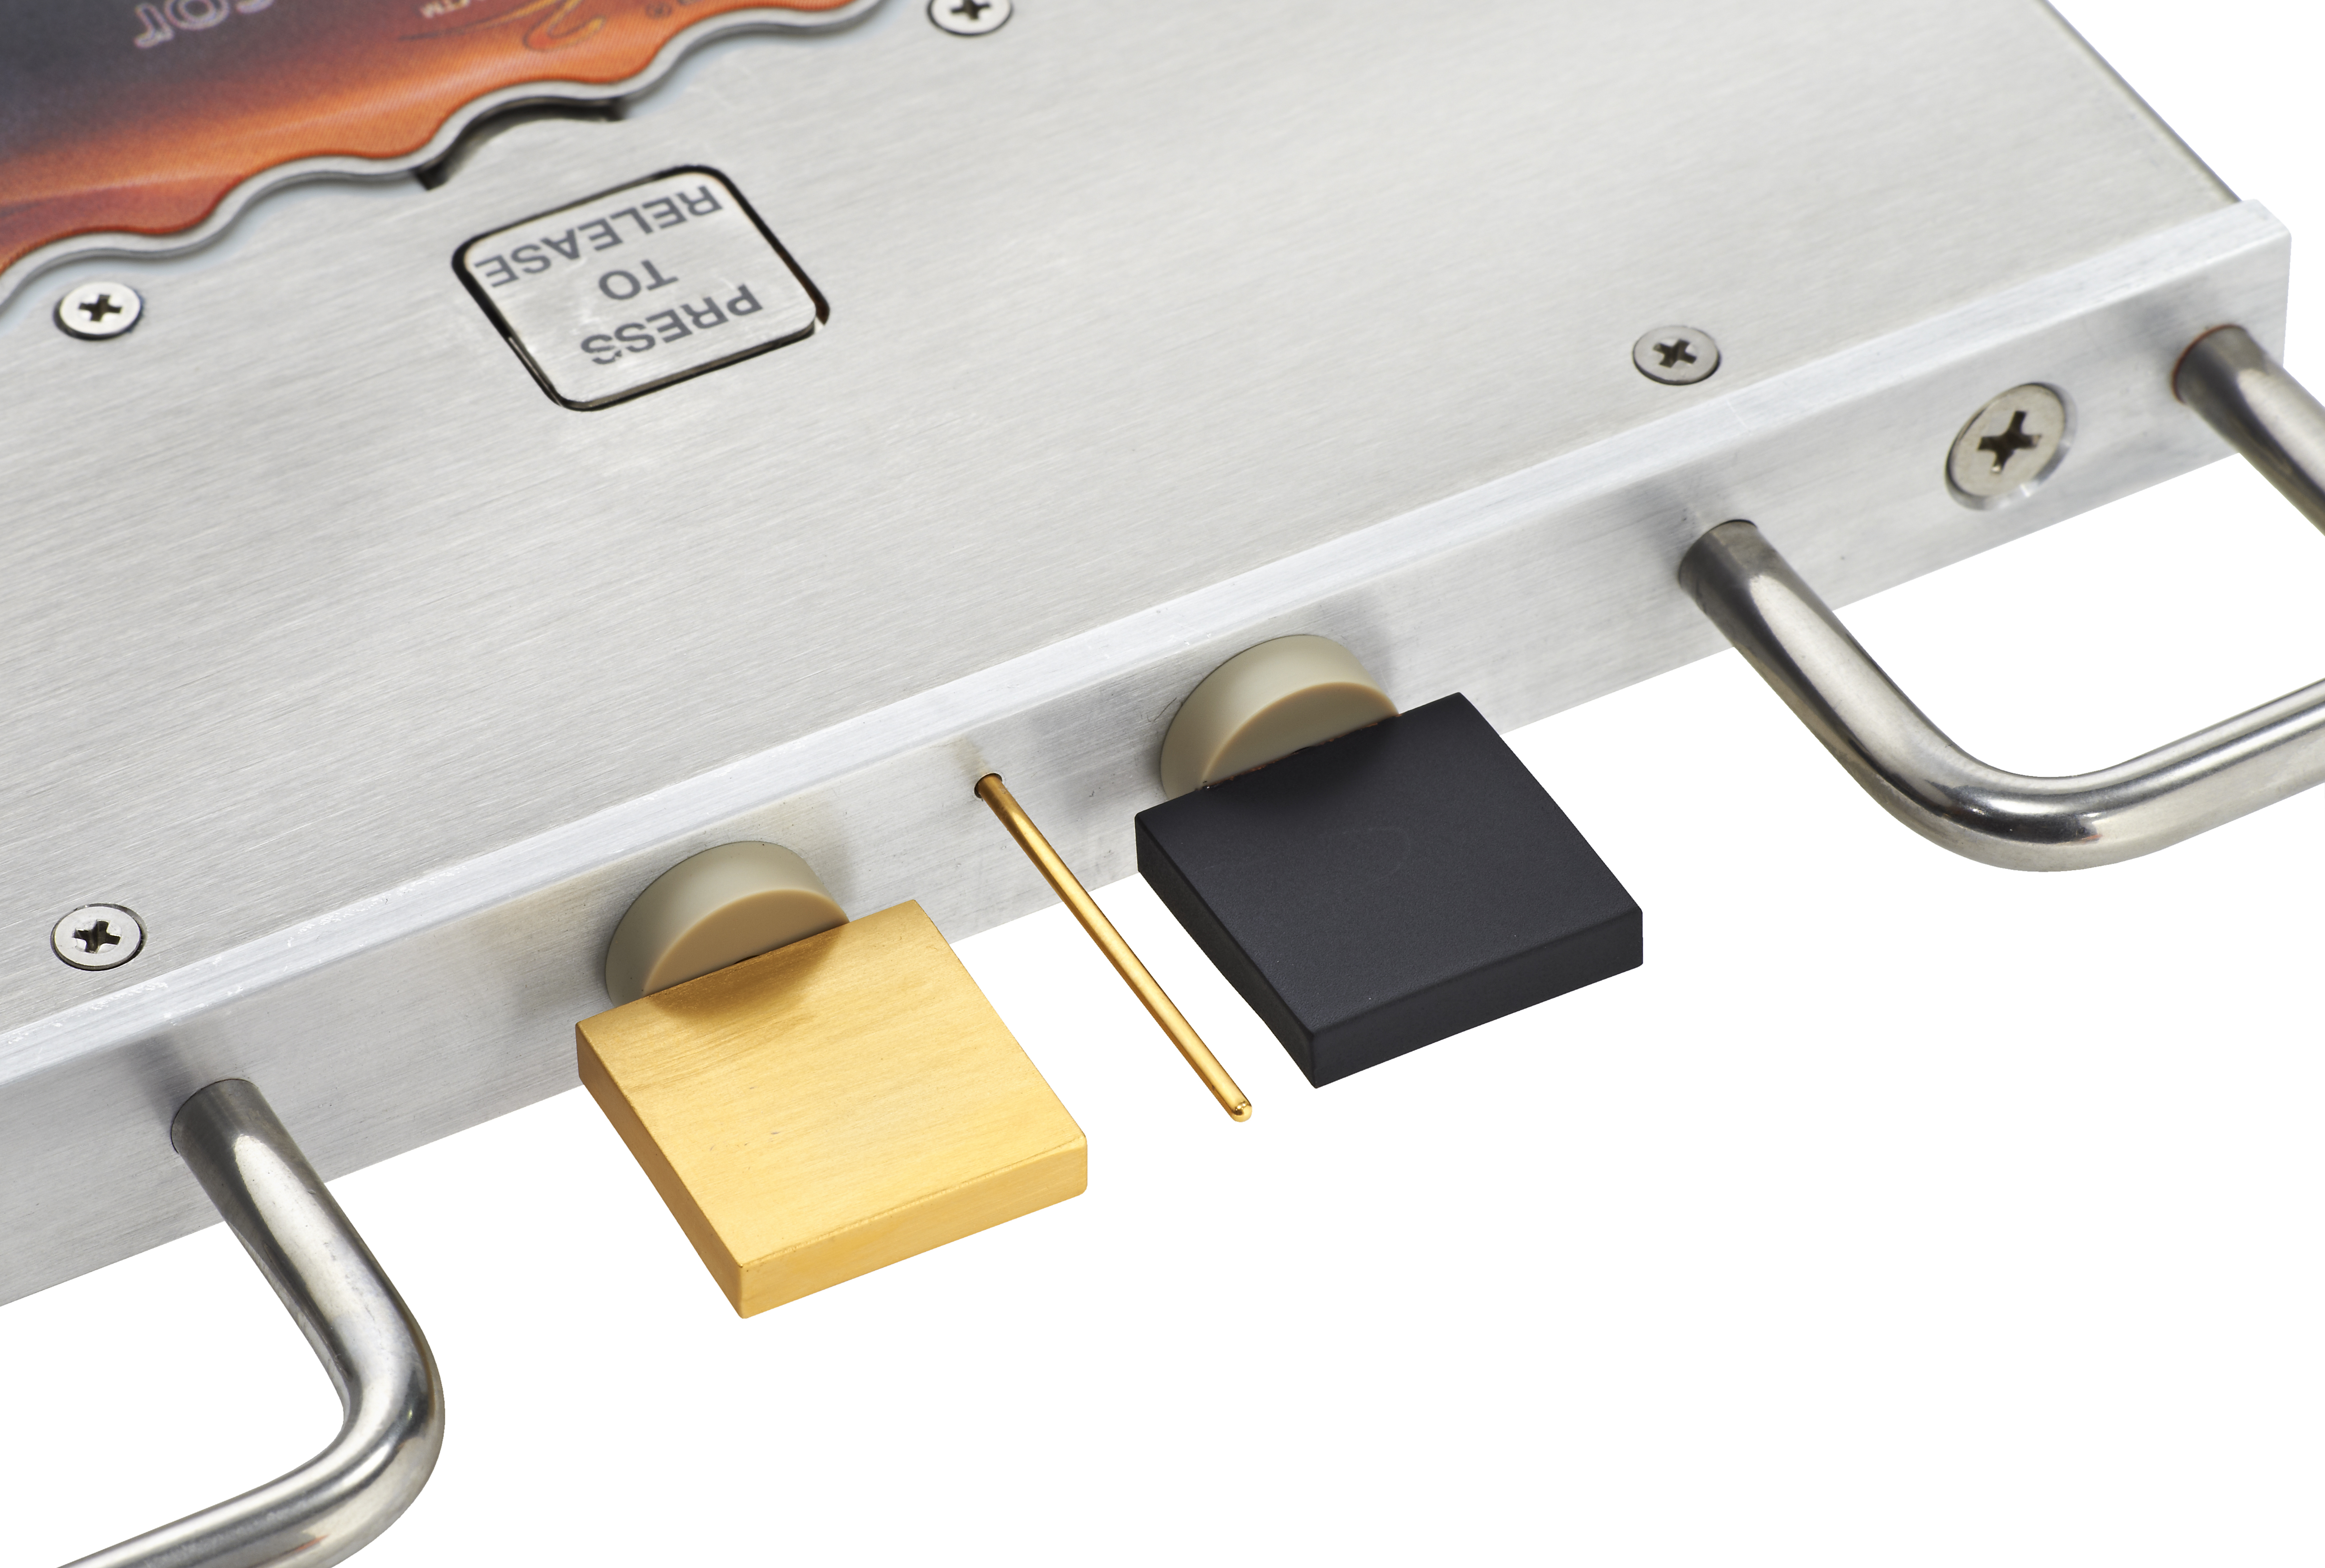
The SCORPION® 2 Heat Flux Sensor is designed to measure convective and radiant heat fluxes at product level, and display the results in Btu/hr·ft2 or W/m2. Convective and radiant heat is absorbed by the band, which serves as the conduction mechanism to the product. The sensor travels through the process with the product, and the oven under full load, yielding a precise profile of heat flux components experienced by the product. Mechanically the sensor is comprised of two copper spades and a bulk air temperature sensor. The black spade provides a measurement summation of convective and radiant heat fluxes, and the gold spade provides a measurement of only the convective heat flux component. The gold plated temperature sensor provides a measurement of the free stream air temperature associated with convection.
Why is Heat Flux Profiling Important?
Product specific characteristics are defined by the amount of heat and the type of heat being applied to the product throughout a process. Heat is transferred to a product via three different mechanisms, each of which can be described by a Heat Flux component associated with radiation, convection, and conduction. Each of these modes of heat transfer is present in baking and other thermal applications. Every product has its own unique mix of heat flux components; there is not one optimal heat flux profile for all products. Heat flux profiles are often used when trying to produce the same product on two different lines, or when trying to transfer product from one line to another. When the heat flux component profiles are matched, the two lines will produce the same product.
Analyzing the Results
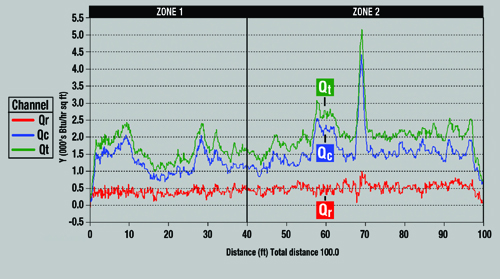
The Heat Flux Sensor measures the flow of energy experienced by the product, from above the conveyor, and identifies which modes of heat transfer are predominant. Raw data from the heat flux sensor consists of several temperature measurements at precise locations in the sensor assembly. A mathematical model, representative of the physical measurement system, is applied to the measured values via the SCORPION® Software (SV8). The resultant heat flux components Qradiant, Qconvective and Qtotal are displayed in a 2D Line Graph against time, distance, or % travel through the process. An interesting note is the large convective spike seen in zone 2 of this oven profile was traced to a separation in an air supply plenum.
 2D Line Graph
- Qradiant, Qconvective, and Qtotal are displayed in a 2D Line graph.
- Large spikes can indicate problems.
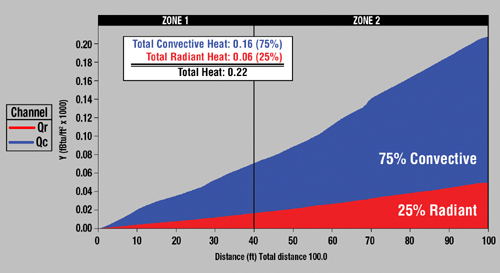
Critical to understanding finished product characteristics is knowing the total heat experienced by the product, and the component quantities of radiant and convective heat fluxes. This is best viewed in the Total Heat Graph displaying the radiant and convective components as Joules/m2 (Btu/ft2). The difference in proportions of heat types explains why one oven bakes differently than another – and analyzing and controlling these differences is fundamental to product quality.
 Total Heat Graph
- Total heat (Btu/ft² or Joules/m²) experienced by the product.
- Proportion of convective and radiant heat.
Case Study
Making the Same Product on Multiple Lines
Problem: One company has four production lines baking soda crackers in three different plants. A new oven was installed, but the best product comes from an oven that is over 20 years old… Click the case study link above to see how Heat Flux Profiling helped solve this problem.