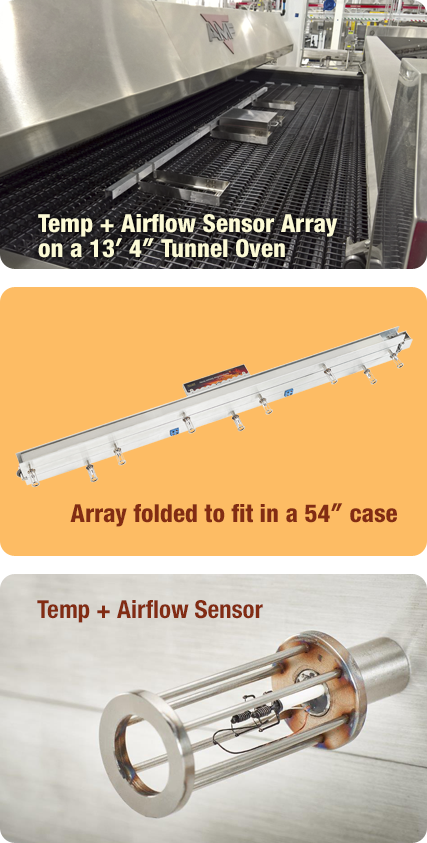
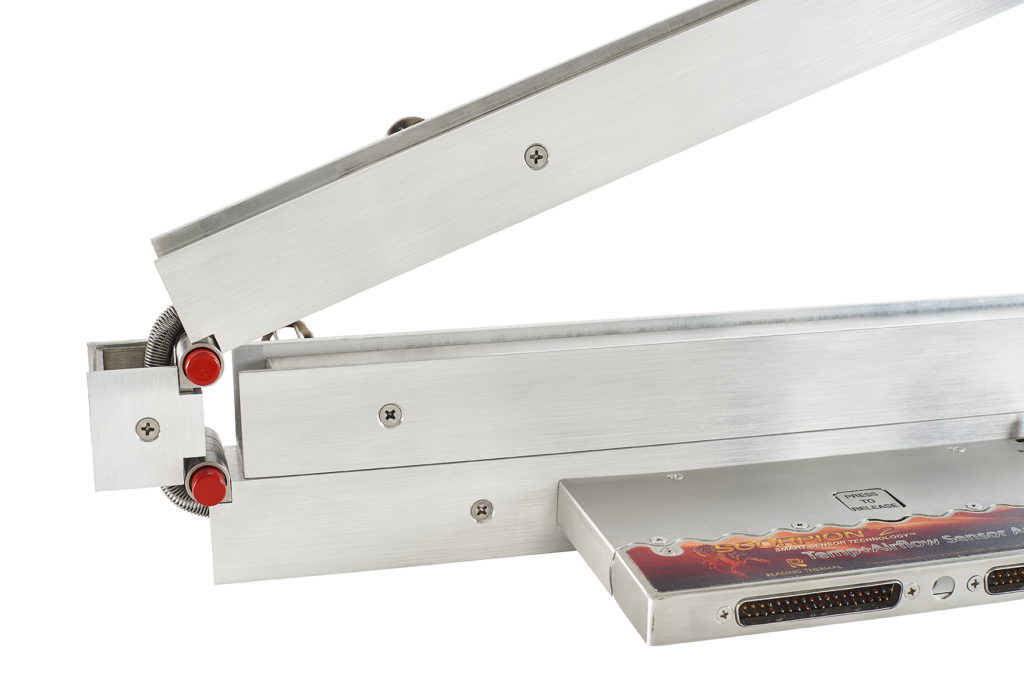
The SCORPION® 2 Digital Temp+Airflow Sensor Array is designed to simultaneously profile temperature and airflow across the width of large tray and grid conveyor ovens exceeding 2m (6.5′). The sensor array contains 9 Temp+Airflow sensors spaced evenly across the length of an aluminum bar. It comes in 3 sizes to match the most popular bread oven conveyor widths – 3.5m (11’6″), 3.8m (12’6″) and 4.0m (13’2″). Custom sizes are available. For easy transportation, the array folds to fit in a 1366mm (53.8″) case. The array also contains 4 product probe inputs to measure product core temperature.
The sensor array is connected to the SCORPION® 2 Data Logger and then travels through the process with the product, and the oven under full load, yielding a precise picture of temperature and airflow from side-to-side and end-to-end.
Why is product level Temperature Profiling important?
Product level temperature throughout an oven can make the difference between optimum quality and throughput – and wasteful, under baked or burnt product. The process of fermentation, product swelling, moisture evaporation, flavor development, and surface coloring are all time and temperature dependent.
Analyzing the Results
SCORPION® Software (SV8) is used to download the data from the SCORPION® 2 Data Logger and analyze the results. The data for each of the sensors can be displayed as a line (channel) in a 2D Line Graph.
2D Line Graph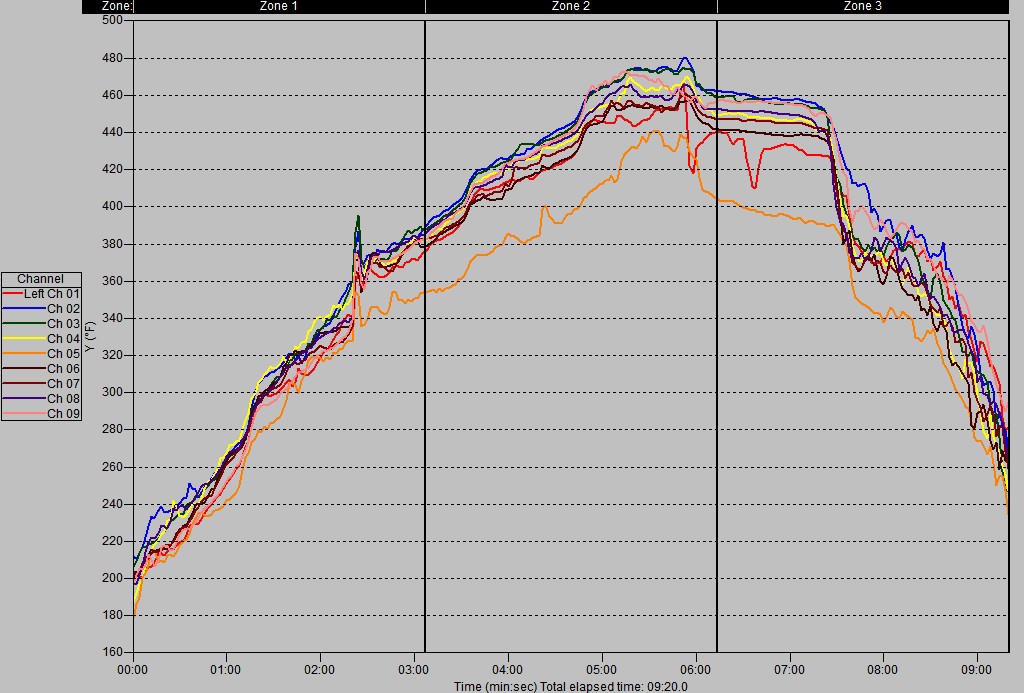
- Each thermocouple is represented by a colored line (channel).
- The tighter the pattern of lines the more even the temperature is across the width of the band.
Individual channels, combinations of channels, and channel averages can be displayed against time, distance, and % travel through the process.
Side-to-side temperature variation is better visualized with a 2D Contour or 3D Mesh Graph.
2D Contour Graph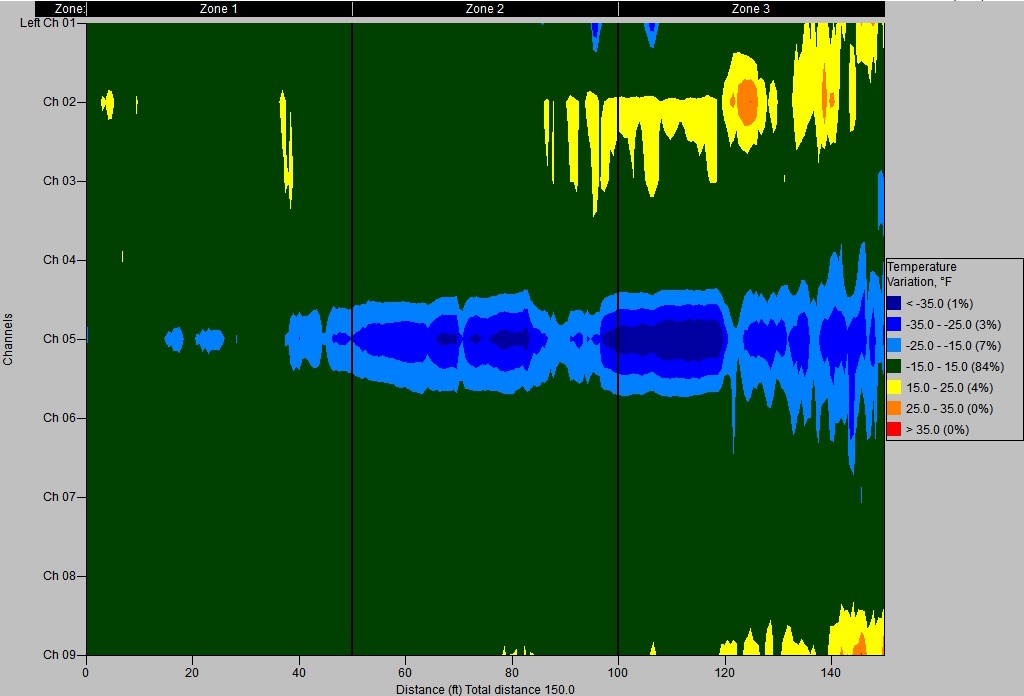
- Side-to-side variation is greater than 34°C (60°F).
- Hotter (yellow) areas and cooler (blue) areas.
3D Mesh Graph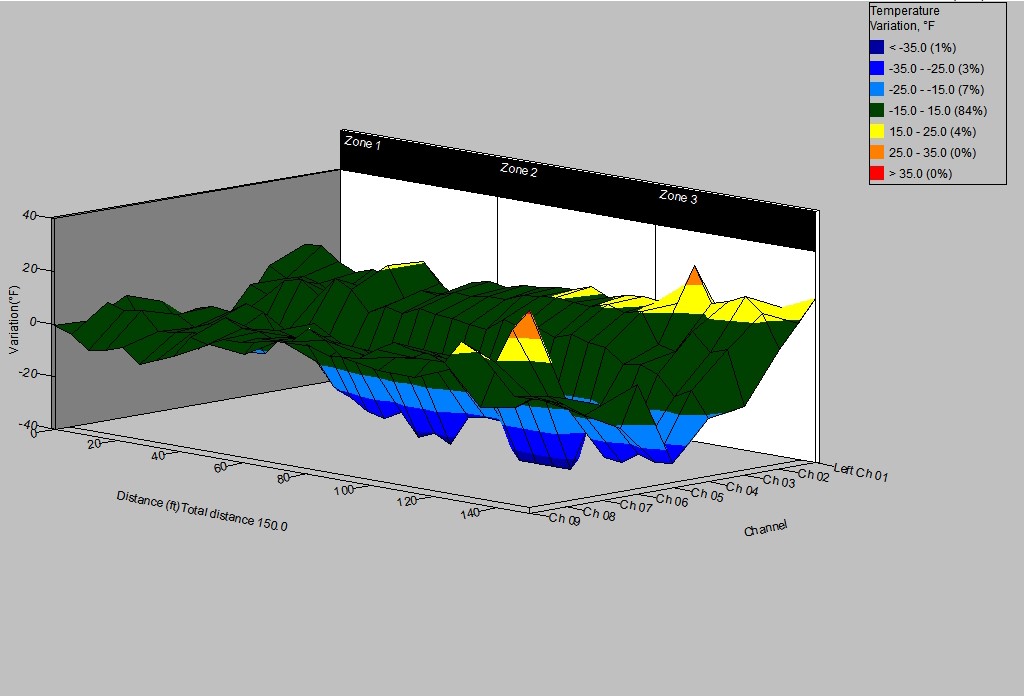
- Side-to-side variation is greater than 34°C (60°F).
- Hotter (yellow) areas and cooler (blue) areas.
Why is Air Velocity Profiling important?
Even distribution of airflow is vital in maintaining the quality of product delivered by any oven system. In a radiant oven, (e.g. ribbon burners) the airflow comes from the moving conveyor, the exhaust system, and natural combustion air currents. In a convection oven, (e.g. air recirculation) the airflow comes primarily from the air distribution plenums. In this case, airflow is of particular importance because it directly controls the amount of heat delivered to the product.
Analyzing the Results
SCORPION® Software (SV8) is used to download the data from the SCORPION® 2 Data Logger and analyze the results. Each sensor output is the sum of air velocity components from all directions, and can be displayed as a line (channel) in a 2D Line Graph.
2D Line Graph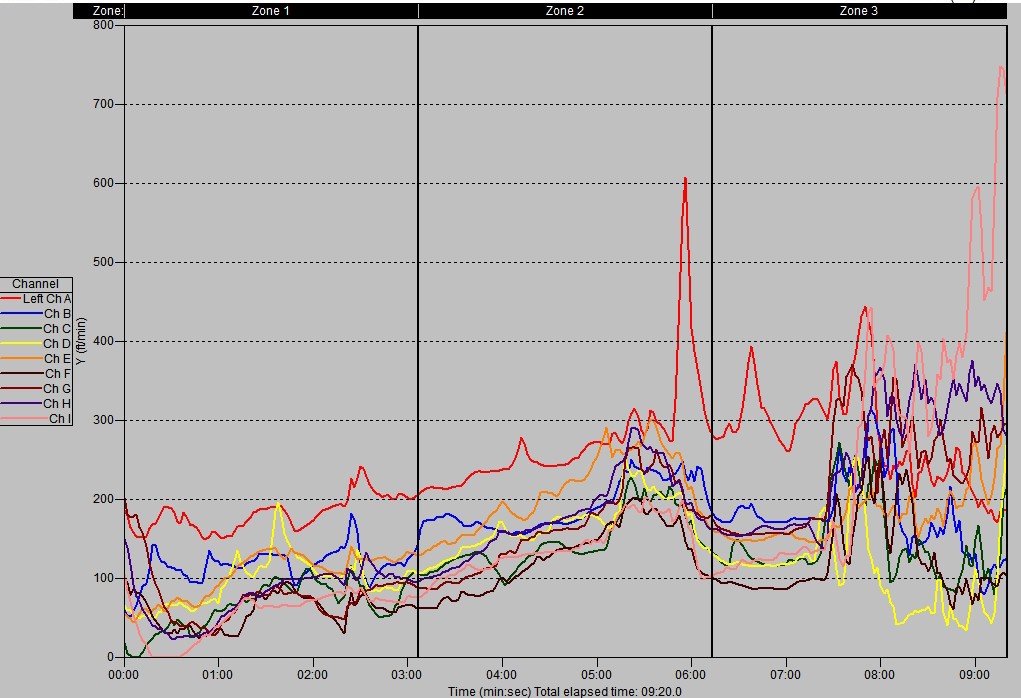
- Each sensor is represented by a colored line (channel).
- The tighter the pattern of lines, the more even the airflow is across the width of the band.
Side-to-side airflow variation is directly related to side-to-side variation in product bake, and represents a critical measurement displayed by the Air Velocity Sensors. The tighter the pattern of lines, the more even the air distribution is across the width of the process.
Visually, side-to-side variation is better displayed in a 2D Contour or 3D Mesh Graph.
2D Contour Graph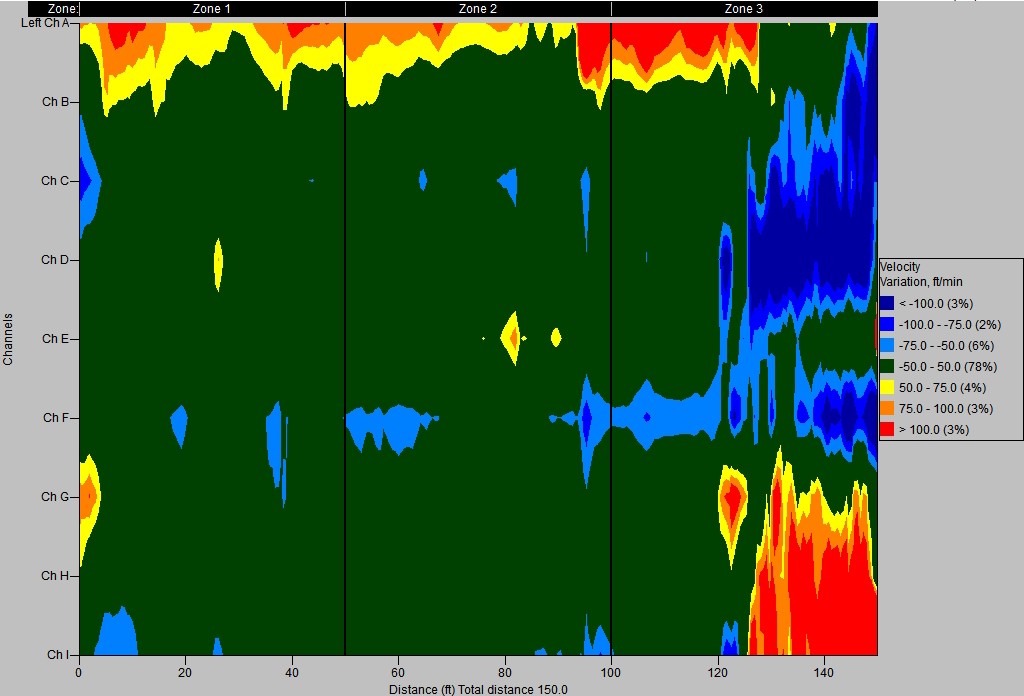
- Side-to-side variation is greater than 1.0 m/sec (200 ft/min).
- Higher airflow (red) areas and lower airflow (blue) areas.
3D Mesh Graph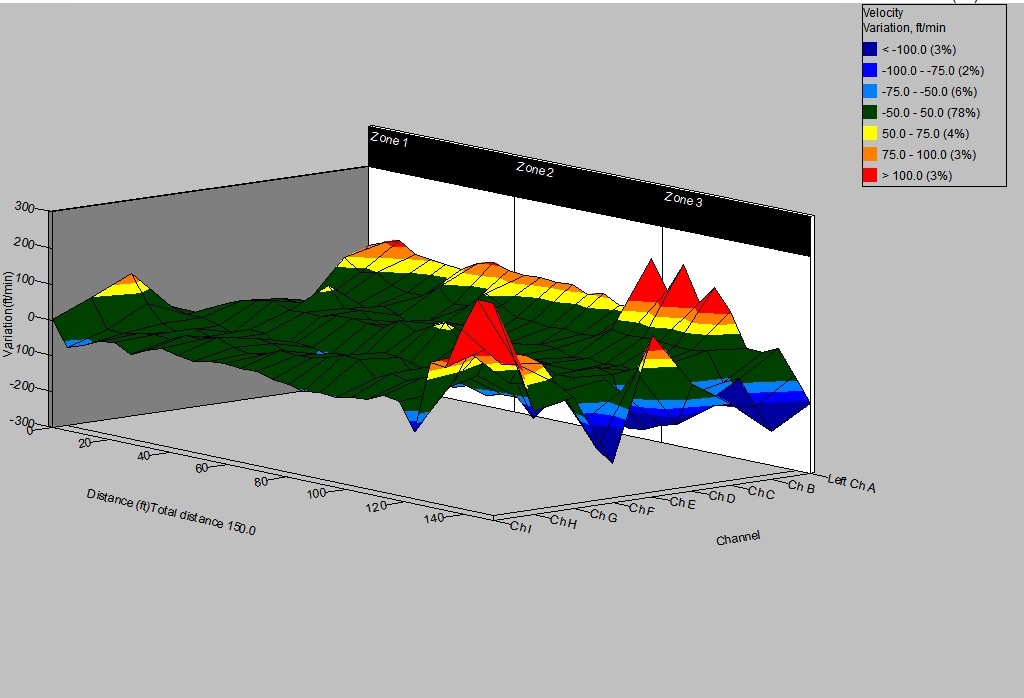
- Side-to-side variation is greater than 1.0 m/sec (200 ft/min).
- Higher airflow (red) areas and lower airflow (blue) areas.
The Air Velocity Sensors can help you spot airflow differences between baking zones, concentrated air velocities on isolated parts of the conveyor, and unwanted air currents at the entrance or exit of the oven. Air Velocity Profiles are useful in adjusting your process to maximize quality and reduce waste.