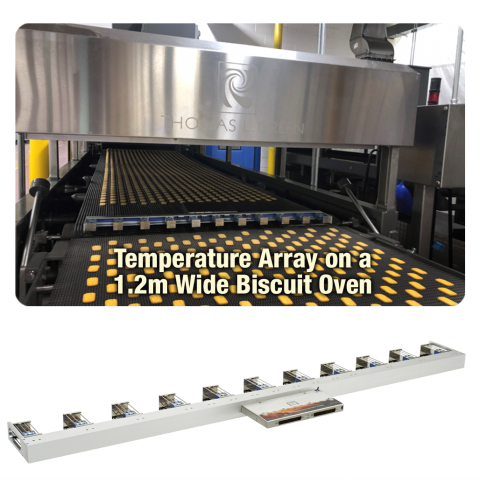
The SCORPION® 2 Temperature Sensor Array is designed to measure temperature at product level, in fixed positions across the conveyor, delivering a true representation of what the product experiences over time. The design contains pluggable thermocouple pairs equally spaced across the length of a bar, which is selected to match the width of the oven band. The number of sensor pairs varies with the length of the bar/conveyor width.
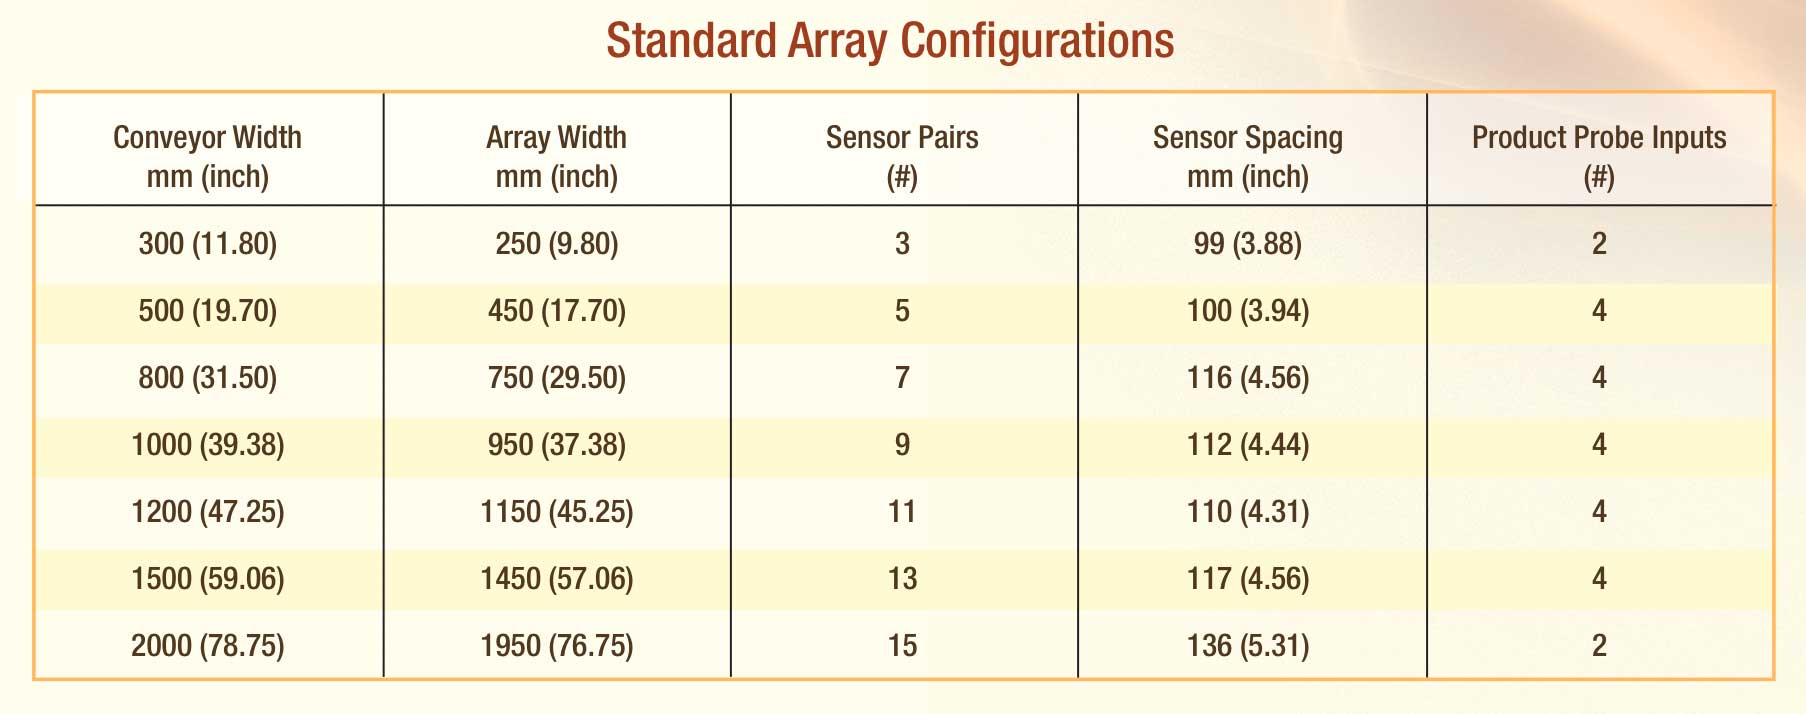
View Standard Array Configurations
The sensor array is connected to the SCORPION® 2 Data Logger and then travels through the process with the product, and the oven under full load, yielding a precise picture of temperature from side-to-side and end-to-end. Simultaneous product-core-temperature measurements can be made via the product probe inputs on the sensor array. There are 2 or 4 product probe inputs on the Temperature Sensor Array (see Standard Array Configurations).
There are 2 Types of Pluggable Temperature Sensors:
Type A is an Air/Conveyor sensor designed to measure air temperature immediately above the conveyor, and surface temperature of the conveyor itself. One thermocouple in each pair measures air temperature; the other is spring-loaded down onto the conveyor surface. Type A Temperature Sensors can only be used with the THB40 & THB50 Thermal Barriers.
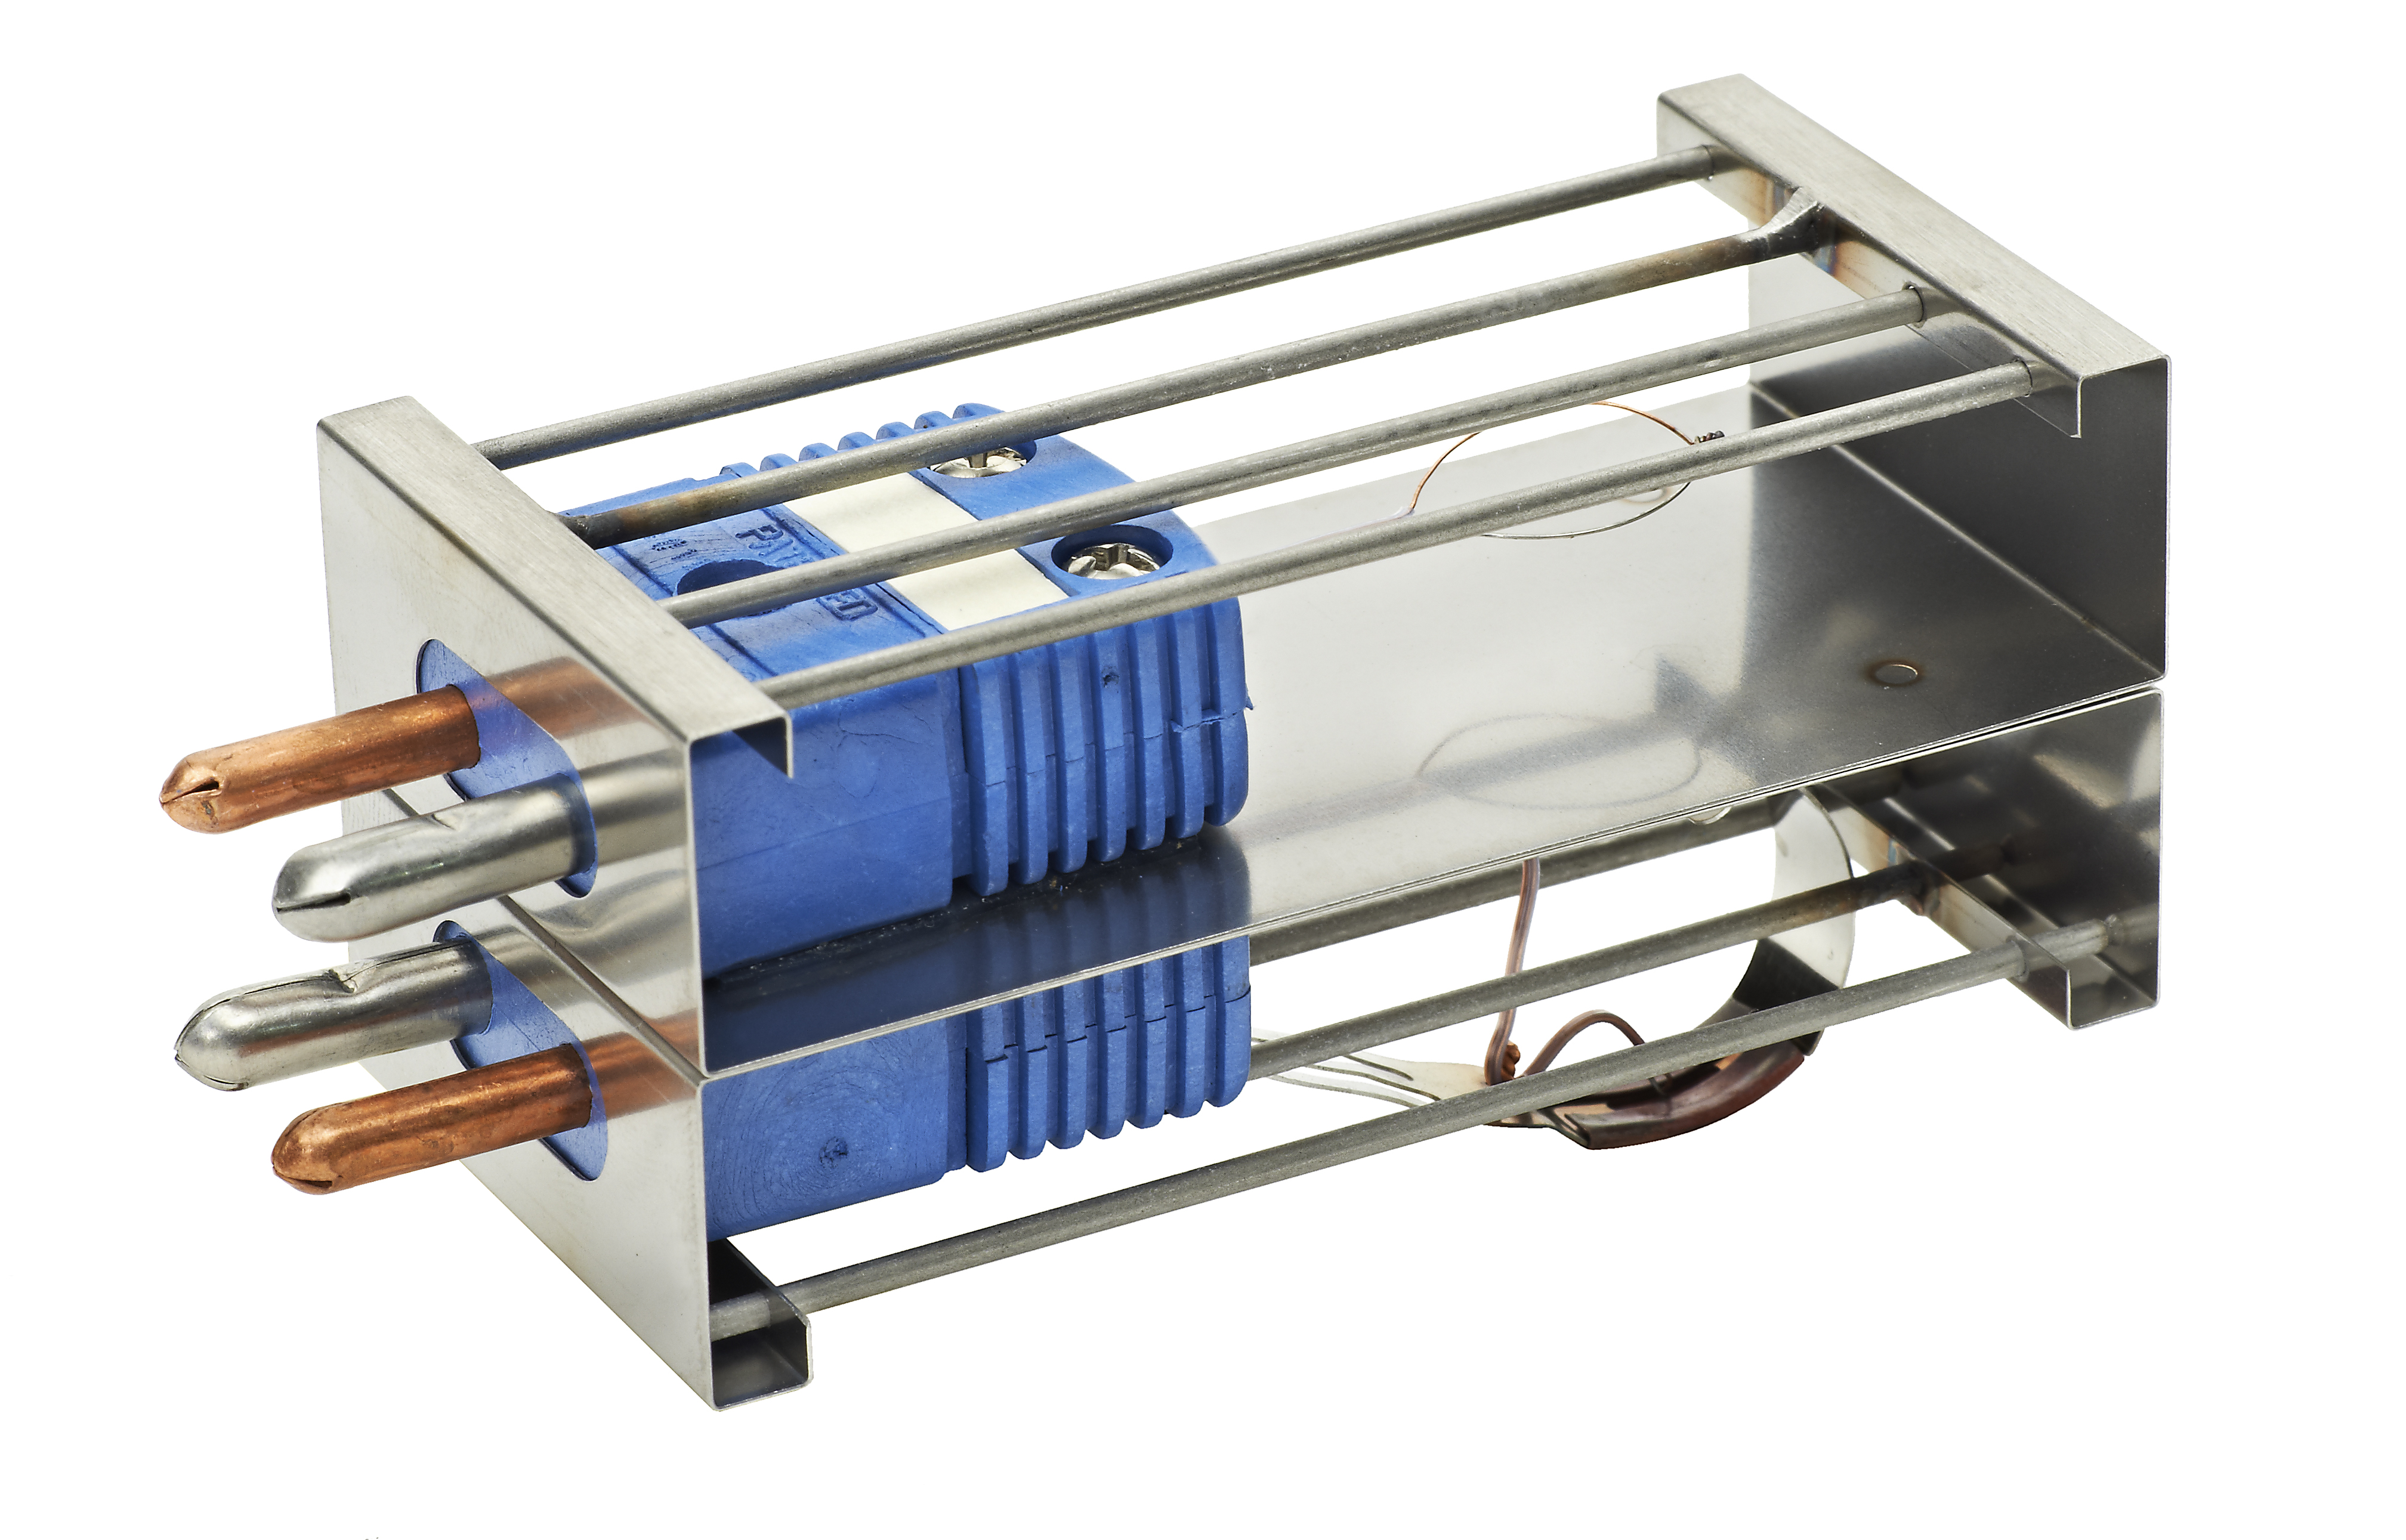 Type A – Air/Conveyor Sensor
- For solid or tight mesh conveyors.
- Measures air and band temperatures.
Type B is an Air/Air sensor designed to measure upper air temperature immediately above the conveyor, and lower air temperature of the air rising through the conveyor. The upper and lower thermocouples are separated by a thin shield.
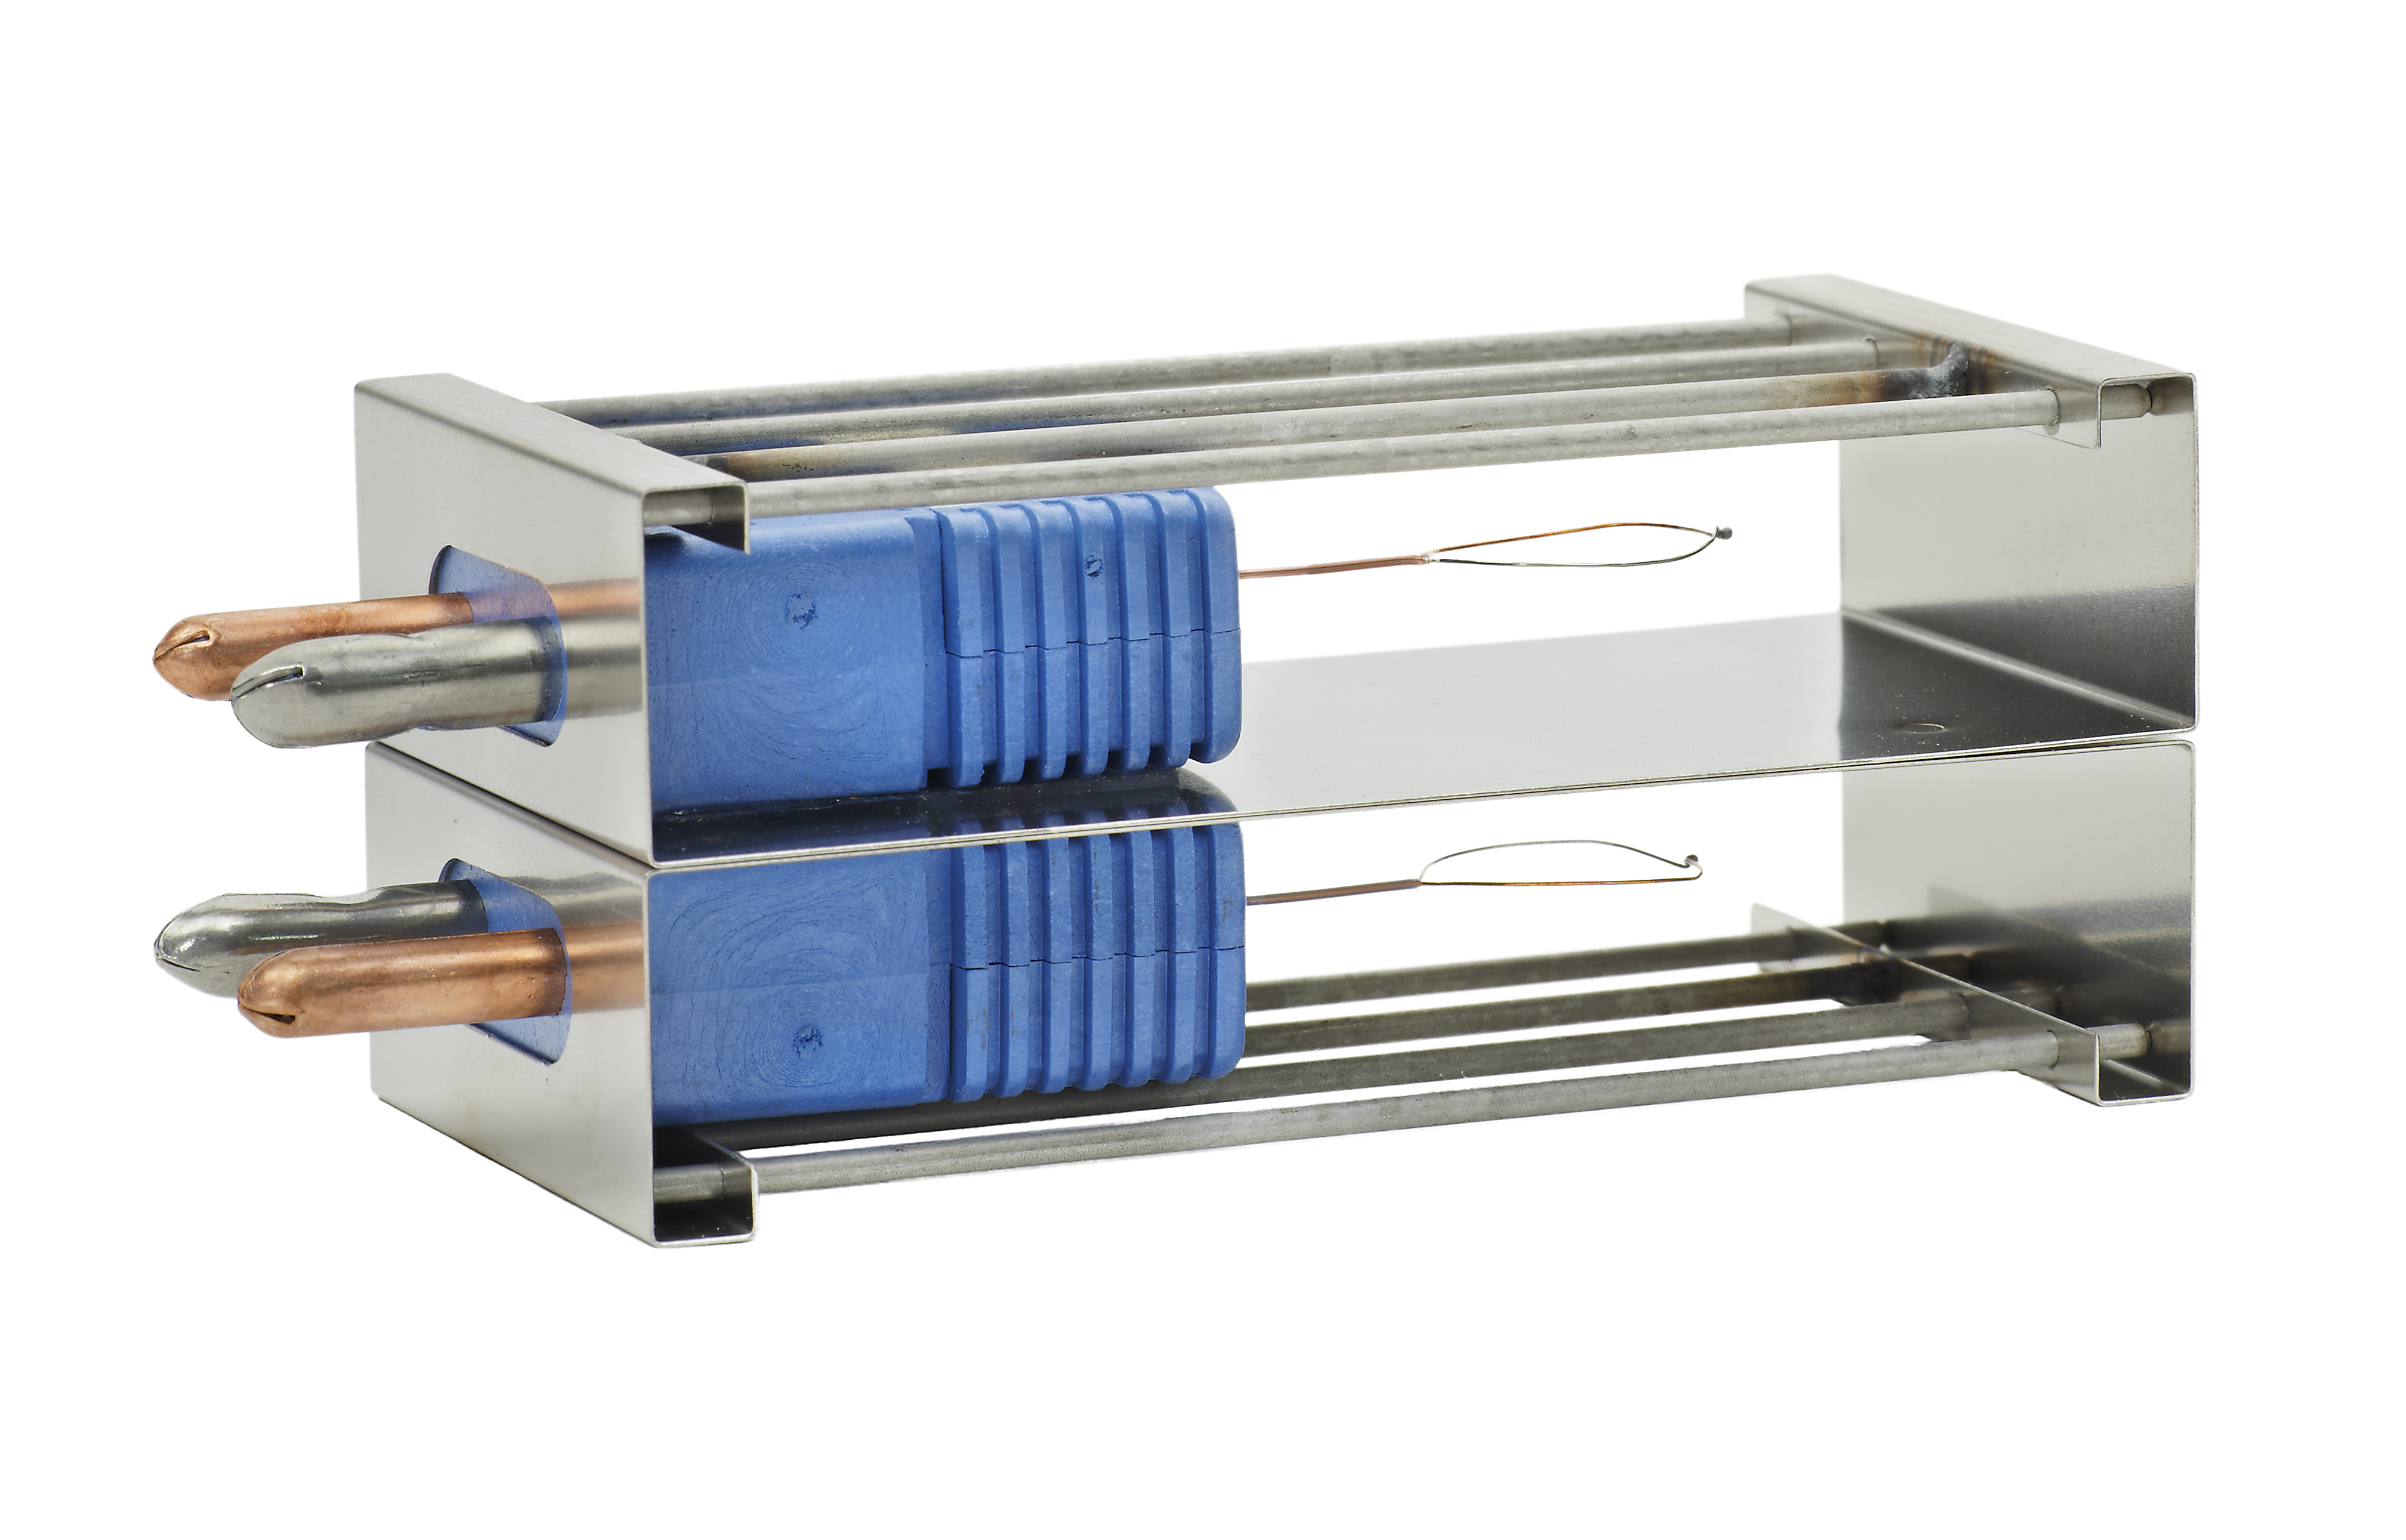 Type B – Air/Air Sensor
- For open mesh conveyors.
- Measures air temperatures above and rising through the conveyor.
Why is product level Temperature Profiling important?
Product level temperature throughout an oven can make the difference between optimum quality and throughput – and wasteful, under baked or burnt product. The process of fermentation, product swelling, moisture evaporation, flavor development, and surface coloring are all time and temperature dependent.
Analyzing the Results
SCORPION® Software (SV8) is used to download the data from the SCORPION® 2 Data Logger and analyze the results. The data for each of the sensors can be displayed as a line (channel) in a 2D Line Graph.
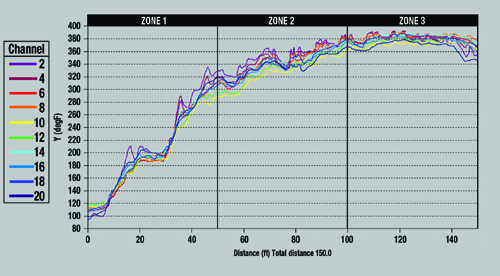 2D Line Graph
- Each thermocouple is represented by a colored line (channel).
- The tighter the pattern of lines the more even the temperature is across the width of the band.
Individual channels, combinations of channels, and channel averages can be displayed against time, distance, and % travel through the process.
Side-to-side temperature variation is directly related to side-to-side variation in product bake, and represents a critical measurement displayed by the Temperature Sensor Array. Side-to-side temperature variation is better visualized with a 2D Contour graph.
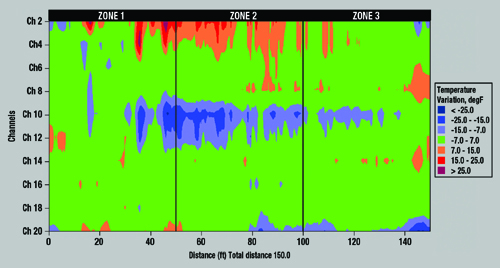 2D Contour Graph
- Side-to-side variation is greater than 28°C (50°F).
- Hotter (red) left side and cooler (blue) center of the band.
Case Study
Problem: A Chicken Processing plant had trouble producing chicken fillets with a consistent bake, causing low yields. A side-to-side and over-time variation in bake occurred sporadically during production runs… Click the case study link above to see how Temperature Profiling helped solve this problem.