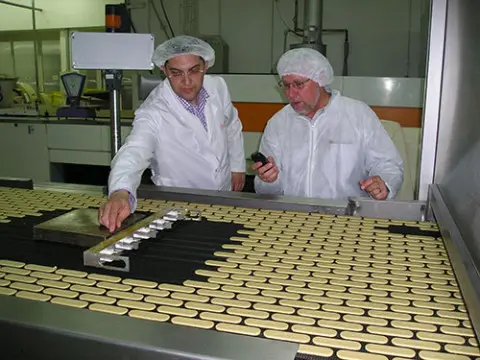
When you capture how the line behaves from cold to ready, you can define a repeatable “ready-to-bake” signature and shorten the wait without risking color, moisture or texture. Using data loggers to monitor and improve oven performance allows you to see the same conditions your product sees, not just set points on a screen – and the SCORPION® 2 Data Logger from Reading Thermal is the best in the business.
Profile The First 15 Minutes, Not Just Steady State
Most profiling happens during steady runs, but the make-or-break moments live in the first 15 minutes. Record a few successful startups and save those curves as your target. Watch how each zone comes up, where infeed air stabilizes, and when the belt surface matches your best-run baseline.
On lines that bake crackers or biscuits, add the SCORPION® 2 Heat Flux Sensor to capture the energy the product actually receives as temperatures rise. You’ll learn that you don’t need to wait for a perfectly flat line – just the point where the energy curve matches your golden start profile.
Use Multiple Lenses For A Full Picture
Temperature alone won’t explain every early-shift defect. Pair the Temperature Sensor Array with the Digital Air Velocity Sensor Array to see when airflow is truly balanced, not just assumed. If one side of the band warms faster, velocity mapping will reveal the imbalance so you can tweak dampers or fans rather than padding the warm-up.
Bring in the Digital Humidity Sensor to spot dew-point trouble at the infeed; a quick exhaust or make-up air adjustment right there can keep early product from sweating and softening. When temperature, airflow, humidity, and heat flux tell the same story, you know you’ve hit the real “go” moment.
Turn Curves Into Faster SOPs
Once you’ve got a handful of good startups logged, convert them into simple steps your team can follow. Instead of “wait 25 minutes,” define success as “Zone 2 matches the reference energy curve and infeed humidity drops below the saved target.” Those cues are faster to reach and more reliable than calendar time because they reflect the day’s actual conditions – ambient weather, belt load and burner performance included. With the SCORPION® 2 software, it’s easy to overlay a live run on your golden profile so operators can call “ready” with confidence.
Don’t Forget Shutdown And Next-Day Restarts
Shutdown analytics save time tomorrow. Profile the cool-down and you’ll see where lingering heat or moisture sets you up for rough restarts and unnecessary purge time. A controlled ramp-down often shortens the next morning’s ramp-up because zones start closer to the right relationship. If you finish the shift with a brief, documented “dry-out” to clear humidity in the tunnel or cooling section, you’ll avoid that early-morning condensation that steals crispness before packaging.
Keep Instruments Safe And The Workflow Simple
Hot, humid spaces can be tough on electronics, even during short profiles. Reading Thermal’s Thermal Barriers protect the SCORPION® 2 logger and sensor arrays so you can capture the entire startup, steady run, and shutdown in one pass. If your focus is temperature during a quick study, the SCORPION® 2 LITE gives you an easy entry point; when you’re ready, add airflow, humidity, or heat-flux measurements to round out the picture. The result is a single, repeatable workflow your team can use any day of the year.
As you can see, data loggers to monitor and improve oven performance can make a major difference in your baking process. Put our technology to the test by contacting us online or calling Reading Thermal at 610-678-5890.

