Heat distribution seems simple until you have to troubleshoot it. The oven says it’s at the right temperature, the controls look normal, and the line is running, yet the product tells a different story. When that happens, you do not just have a “temperature issue.” You have a heat distribution issue. Learning how to accurately measure heat distribution in an industrial oven is easy. Simply turn to technology from Reading Thermal.
Why Heat Distribution Matters More Than Setpoints
Setpoints are targets, not proof. Industrial ovens can be long, multi-zone systems with moving belts, fans, burners, ductwork, and openings where air can leak in or escape. All of that creates patterns. Some areas run hotter, some cooler, and some change depending on load, belt speed, or the product you are running that day.
Heat distribution affects color, texture, moisture loss, and throughput. It also affects waste. If you start “fixing” a hot spot by lowering overall temperature, you might protect one area while underbaking another. Measuring distribution lets you solve the real problem instead of shifting it around.
The Best Approach to Measuring Distribution
To measure heat distribution, you need data from multiple points, not just one probe. You want to map conditions across the oven and across time. That usually means sending a set of sensors through the oven under normal operating conditions, then reviewing the results in software that shows where the differences are.
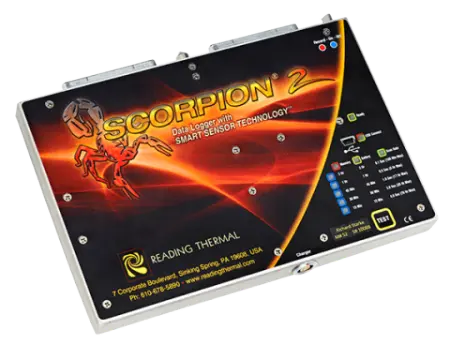
Reading Thermal’s SCORPION® 2 Profiling System is designed for this type of work. It pairs the SCORPION® 2 Data Logger with sensors that travel through the process and record what’s happening as the run moves through each zone. Instead of relying on the oven control panel, you collect a profile that reflects the conditions your product is actually experiencing.
Using a Temperature Sensor Array to See the Whole Oven
Our SCORPION® 2 Temperature Sensor Array can capture readings from several locations at the same time. In a belt oven, that means you can measure across the width of the belt, not just down the center. You can also measure different heights, which can matter when airflow patterns change from top to bottom.
With an array run, you don’t have to guess whether the left side is hotter than the right. You can see the difference, zone by zone, and quantify it. That’s important because small differences can lead to big changes in product quality, especially on high-speed lines.
Adding Airflow and Heat Flux for a Clearer Picture
Temperature distribution is a big part of the story, but it’s not the only part. Two areas can show similar temperatures while behaving differently because airflow and energy transfer aren’t the same. This is where adding more measurements can help without making the work overly technical.
Our SCORPION® 2 Digital Air Velocity Sensor Array helps you learn whether one zone is pushing more air than another or whether airflow is uneven across the belt. Heat flux measurement adds another useful layer because it reflects how energy is transferring to the product surface. When teams struggle with uneven browning, or texture, heat flux data can help explain why.
You don’t need to spend any more time researching how to measure heat distribution in an industrial oven. Reading Thermal supports these kinds of measurements within its profiling approach, so you can build a more complete picture of what is happening inside. Learn more by contacting us online or calling 610-678-5890.